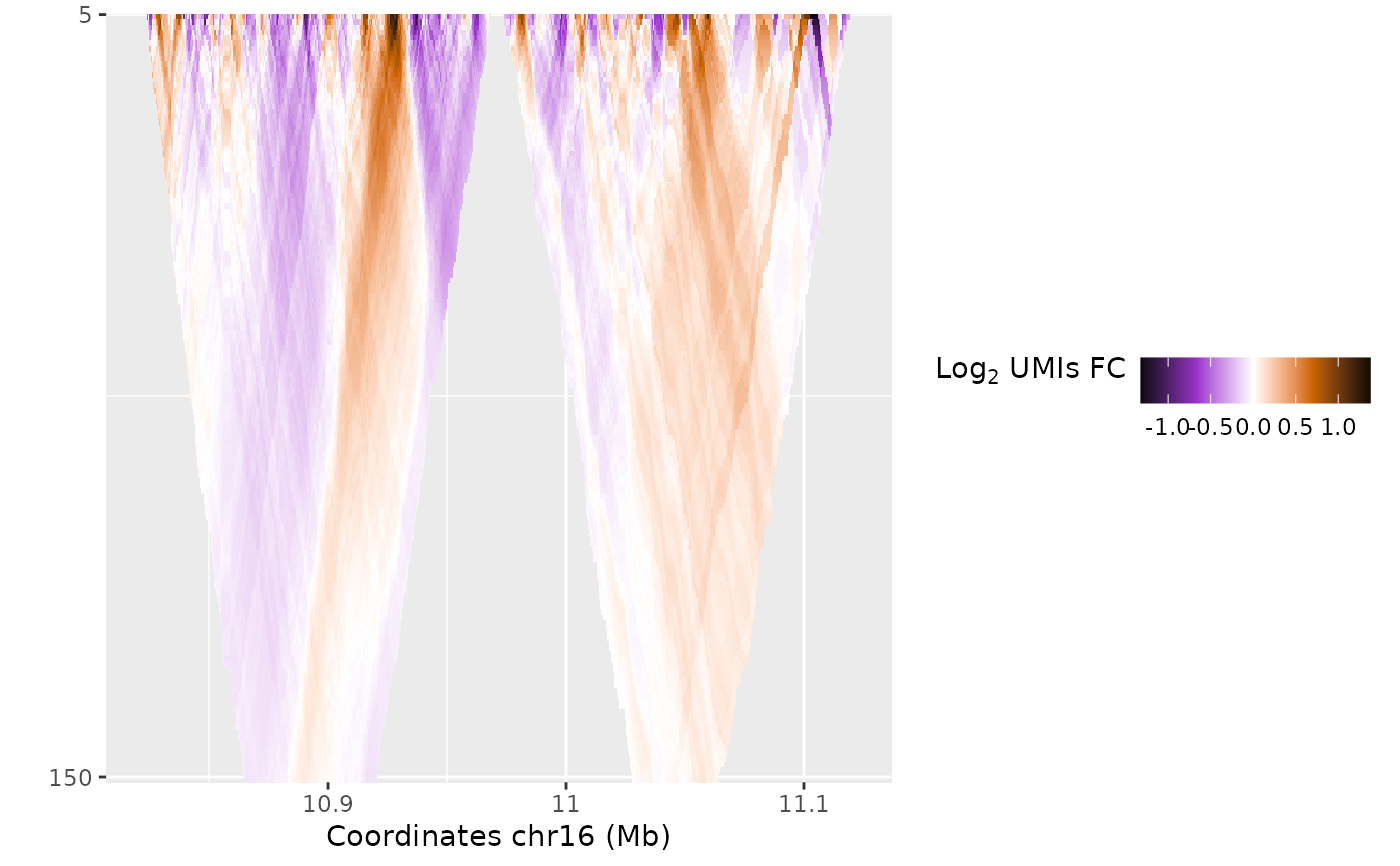
Plot domainogram
plotDomainogram(
  umi4c,
  dgram_function = "quotient",
  grouping = NULL,
  colors = NULL,
  xlim = NULL
)
Arguments
| umi4c | |
|---|---|
| dgram_function | Function used for calculating the fold-change in the domainogram plot, either "difference" or "quotient". Default: "quotient". |
| grouping | Grouping used for the different samples. If none available or
want to add new groupings, run |
| colors | Named vector of colors to use for plotting for each group. |
| xlim | Limits for the plot x axis (genomic coordinates). |
Value
Produces the domainogram plot, summarizing the merged number of UMIs at the different scales analyzed (y axis).
Examples
data("ex_ciita_umi4c")
ex_ciita_umi4c <- addGrouping(ex_ciita_umi4c, grouping="condition")

plotDomainogram(ex_ciita_umi4c, grouping = "condition")
