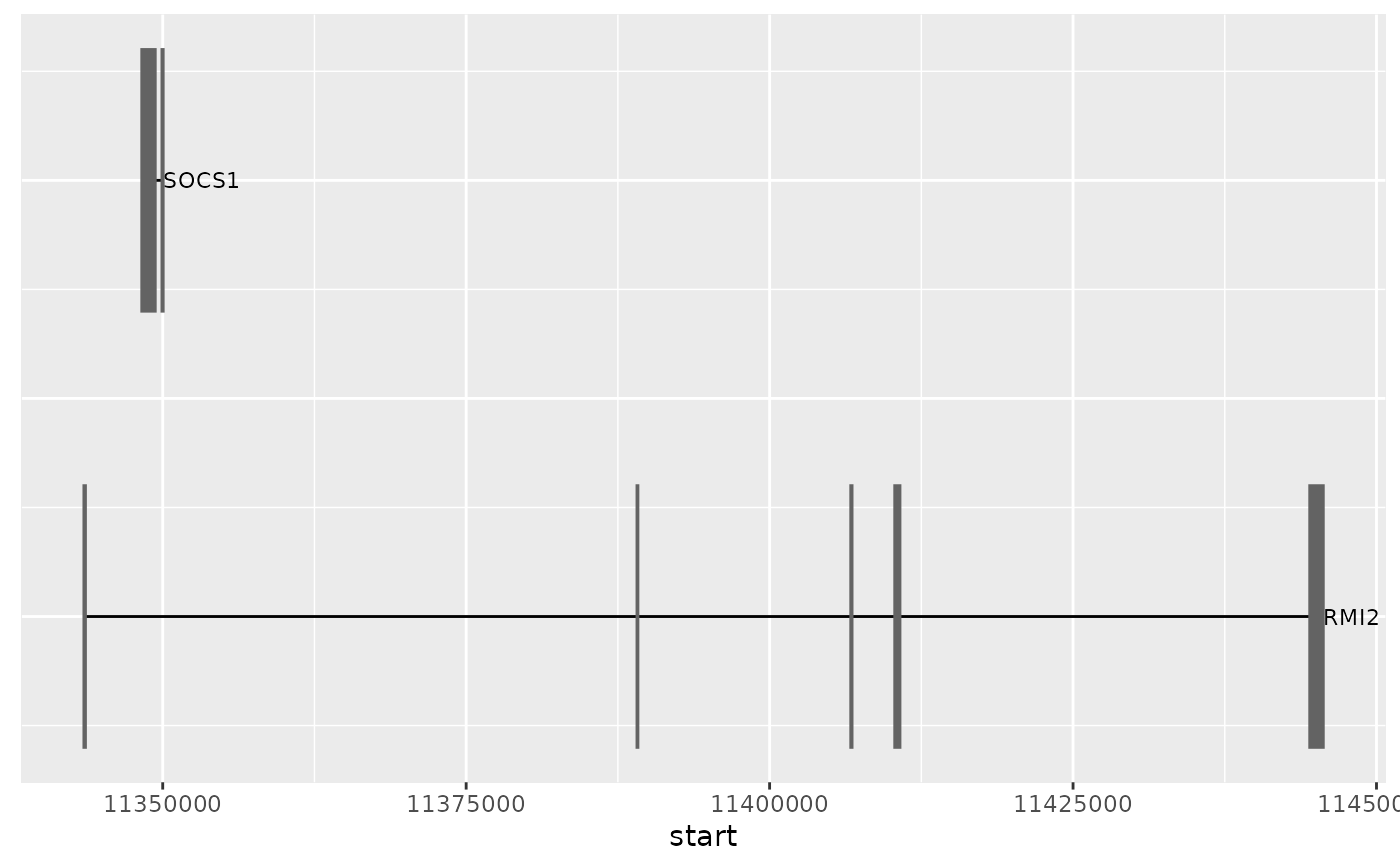
Plot genes in a window of interest.
plotGenes(
  window,
  TxDb = TxDb.Hsapiens.UCSC.hg19.knownGene::TxDb.Hsapiens.UCSC.hg19.knownGene,
  longest = TRUE,
  xlim = NULL,
  font_size = 14
)
Arguments
| window | GRanges object with coordinates to use for selecting the genes to plot. |
|---|---|
| TxDb | TxDb object to use for drawing the genomic annotation. |
| longest | Logical indicating whether to plot only the longest transcripts for each gene in the gene annotation plot. |
| xlim | Limits for the plot x axis (genomic coordinates). |
| font_size | Base font size to use for the UMI4C plot. Default: 14. |
Value
Produces a plot with the genes found in the provided window.
Examples
window <- GRanges("chr16:11348649-11349648") plotGenes( window = window, TxDb = TxDb.Hsapiens.UCSC.hg19.knownGene::TxDb.Hsapiens.UCSC.hg19.knownGene )#>